I told you in my last chicken post that chicken are tyrants to work for. Not only do I have to keep their schedules, there are also records to keep. Tyrants, I tell you!
I need new bosses.
Or better jokes.
But if you’re going to keep chickens for profit, then you’ll eventually need to figure out whether or not you’re actually making a profit. If you’re not, it’s like our accountant likes to tell us… “You know you’re just supplementing other people’s grocery bills, right?”
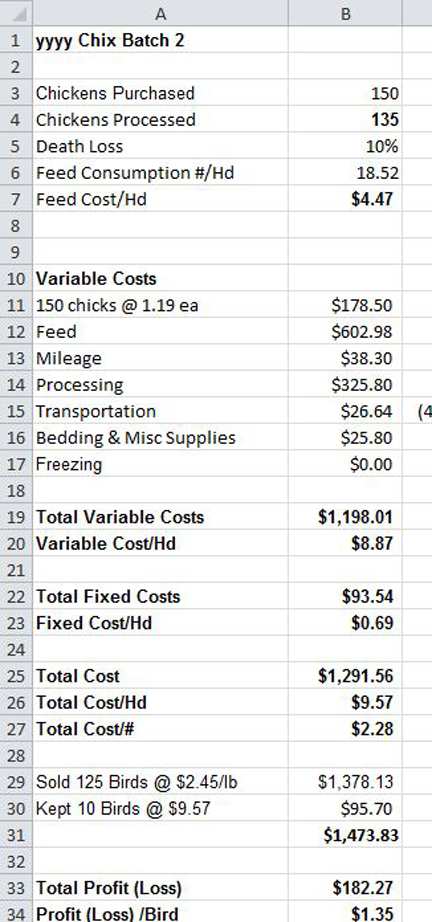
I like to use a spreadsheet. This is just a tool we use for decision making. We use QuickBooks for the record keeping we actually base our tax returns on. Some of the numbers in the spreadsheet (like feed costs) come from QuickBooks. Here’s an example of what I use with some made up numbers:

What you can’t see are the formulas behind some of the cells. The death loss is calculated as (B3 – B4)/B3
The feed consumption and cost per head are calculated using specifics from another area of the spreadsheet:

So feed consumption per head is the Total Pounds divided by Chickens Processed, and feed cost per head is the Total Feed Cost divided by Chickens Processed. These numbers are useful because improving them improves your profit per bird.
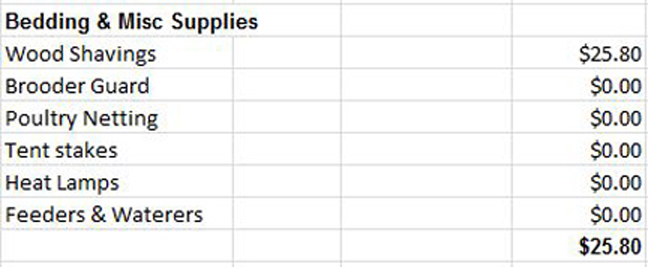
Then you have Variable Costs. These include the costs of purchasing the chicks; the cost of the feed (which can be pulled directly from the Total Feed Cost cell); round-trip mileage to the hatchery and processor, calculated at the IRS mileage rate for the current year; processing costs; and the cost of other miscellaneous supplies. I usually break out the miscellaneous costs off to the side like this:

and then pull that total directly into the “Bedding & Misc Supplies” line item in the first picture. Divide Total Variable Costs by Chickens Processed to get Variable Cost/head.
Then there are fixed costs that are spread out over the “life” of the asset. Furthermore I divide each year’s cost for that asset between the number of batches I’m doing that year. I just made a best guess as to how many years to depreciate these costs for each asset, and I keep track of what year I’m on in the spreadsheet. (I noticed that I have “poultry netting” in both Supplies and Fixed Costs. It should just be in Fixed Costs.)

Pull that total directly over into the Total Fixed Costs cell, and then divide that total by Chickens Processed to get Total Cost/head.
The rest of the calculations go like this:
Total Cost = Total Variable Costs + Total Fixed Costs
Total Cost per Head = Total Cost / Chickens Processed
Total Cost per Pound = Total Cost / average processed weight per chicken (in this example I used 4.5 pounds)
Then I list the sales. You can either enter your actual sales (from QuickBooks or whatever accounting record keeping you use), or you can just use the average processed weight per chicken multiplied by the number of chickens sold. That will get you close enough for the purposes of a decision making tool.
I also list the chickens we kept, but I list those at cost. If you don’t include these, you won’t get a true picture of your profit.
So finally,
Total Profit = Total Income – Total Cost
Total Profit per Head = Total Profit / Chickens Processed
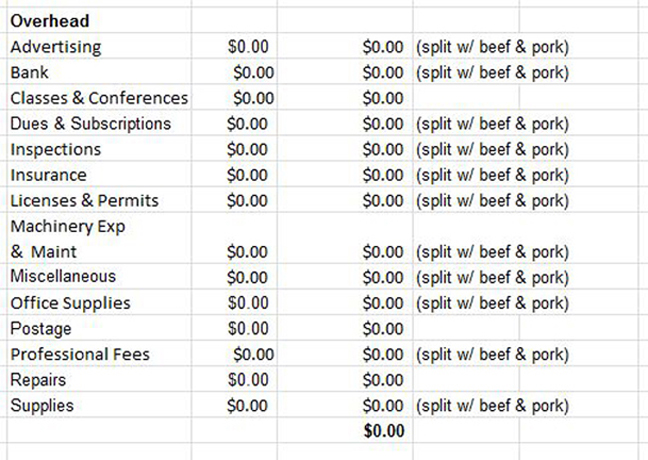
There’s one other cost that should be included, but I don’t quite have it here yet. That’s Overhead Costs – things like Insurance, Rent, Bank Fees, etc.

If you’re only raising chickens, then you can just include all of these as part of your Total Costs. If you have other sources of income, then you have to split those overhead costs over each of your income classes. For us, that would be beef, pork, and chickens. I won’t get into the specifics of how to allocate those expenses between each class, but you get the idea.
Having these numbers helps with a lot of decision making! Knowing your true costs helps you determine what you need to charge. You can address specific costs to see if they can be lowered, which will improve your bottom line. It takes time to set up a system, and time to keep that system up-to-date, but so important if you want to be supplementing your own grocery bill instead of your customers’.
5 years ago:

